


 Views Today : 123
 by
by
https://www.eurekalert.org/pub_releases/2021-04/ssfo-hhe043021.php
Holographic histopathology enables fast, precise diagnostics
New optical diffraction tomography method increases imaging speed and resolution for improved diagnostics in histopathology

CREDIT: HUGONNET ET AL.
Histology is the study of biological tissues at a microscopic level. Also called microscopic anatomy, histology is widely used to provide diagnosis of cancer and other diseases. For example, tissue samples obtained during surgery might help to determine whether further surgical action is needed, and further surgery may be avoided if a diagnosis can be rapidly obtained during an operation.
Traditional methods in histopathology are generally limited to thin specimens and require chemical processing of the tissue to provide sufficiently high contrast for imaging, which slows the process. A recent advance in histopathology eliminates the need for chemical staining and enables high-resolution imaging of thick tissue sections. As reported in Advanced Photonics, an international research team recently demonstrated a 3D label-free quantitative phase imaging technique that uses optical diffraction tomography to obtain volumetric imaging information. Automated stitching simplifies the image acquisition and analysis.
Optical diffraction tomography
Optical diffraction tomography is a microscopy technique for reconstructing the refractive index of a tissue sample from its scattered field images obtained with various illumination angles. It enables label-free high contrast visualization of transparent samples. The complex scattered field transmitted through the sample is first retrieved using off-axis holography, then the scattered fields obtained with various angle of illuminations are mapped in the Fourier space enabling the reconstruction of the sample refractive index.
A recognized limitation of optical diffraction tomography is due to the complex distribution of refractive indexes, which results in significant optical aberration in the imaging of thick tissue. To overcome this limitation, the team used digital refocusing and automated stitching, enabling volumetric imaging of 100-m-thick tissues over a lateral field of view of 2 mm 1.75 mm while maintaining a high resolution of 170 nm 170 nm 1400 nm. They demonstrated that simultaneous visualization of subcellular and mesoscopic structures in different tissues is enabled by high resolution combined with a wide field of view.
Fast, accurate histopathology
The researchers demonstrated the capacity of their novel method by imaging a variety of different cancer pathologies: pancreatic neuroendocrine tumor, intraepithelial neoplasia, and intraductal papillary neoplasm of bile duct. They imaged millimeter-scale, unstained, 100-μm-thick tissues at a subcellular 3D resolution, which enabled the visualization of individual cells and multicellular tissue architectures, comparable to images obtained with traditional chemically processed tissues. According to YongKuen Park, researcher at the Korea Advanced Institute of Science and Technology and senior author on the study, “The images obtained with the proposed method enabled clear visualization of different morphological features in the various tissues allowing for recognition and diagnosis of precursor lesions and pathologies.”
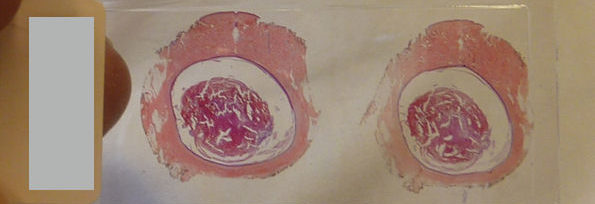
Volumetric histopathology of unlabeled 100-μm-thick pancreas tissue sample from a patient with intraductal papillary neoplasm of bile duct in the liver. For the purpose of comparison, adjacent tissues were prepared in thin tissue slides with conventional H&E staining method. (the fifth row, 400x magnification). Image credit: Hugonnet et al., doi 10.1117/1.AP.3.2.026004.
Park notes that further research is needed, but the results suggest great potential for fast, accurate histopathology during surgery: “More research is needed on sample preparation, reconstruction speed, and mitigation of multiple scattering. We expect optical diffraction tomography to provide faster and more precise diagnostics in histopathology and intraoperative pathology consultations.”
Read the open access article by Herve Hugonnet et al., “Multiscale label-free volumetric holographic histopathology of thick-tissue slides with subcellular resolution,” Adv. Photon. 3(2), 026004 (2021), doi 10.1117/1.AP.3.2.026004
Histopathology relies upon the staining and sectioning of biological tissues, which can be laborious and may cause artifacts and distort tissues. We develop label-free volumetric imaging of thick-tissue slides, exploiting refractive index distributions as intrinsic imaging contrast. The present method systematically exploits label-free quantitative phase imaging techniques, volumetric reconstruction of intrinsic refractive index distributions in tissues, and numerical algorithms for the seamless stitching of multiple three-dimensional tomograms and for reducing scattering-induced image distortion. We demonstrated label-free volumetric imaging of thick tissues with the field of view of 2 mm × 1.75 mm × 0.2 mm with a spatial resolution of 170 nm × 170 nm × 1400 nm. The number of optical modes, calculated as the reconstructed volume divided by the size of the point spread function, was ∼20 giga voxels. We have also demonstrated that different tumor types and a variety of precursor lesions and pathologies can be visualized with the present method.
1.
Introduction
Microscopic assessment of biopsied and resected tissues is central to understanding the underlying pathophysiology and clinical states of many patients. Because most microscopic specimens are translucent to visible light, conventional histological methods achieve image contrast using exogenous labels, such as haematoxylin and eosin (H&E) or immunohistochemical labeling.1–3 Although these procedures allow pathologists to easily identify cellular processes due to high specificity, they have several limitations, including heavy use of chemicals during sample preparation, which can induce artifacts and distort samples;4 long sample preparation time, which can delay pathological diagnosis; and labor-intensive histochemical processes.5 Importantly, the staining and visualization of thicker () tissues using traditional histology is limited by strong light absorption and scattering. Although recent advances in structured illumination microscopy6 and light-sheet microscopy7 have alleviated many of those disadvantages, label-free microscopy is still attractive because it might further reduce sample preparation.
A variety of diverse label-free microscopy methods have been employed to circumvent these challenges. Nonlinear microscopy methods are widely used8 because chemical specificities are retained without exogenous labels via characteristic vibrational modes9,10 or nonlinear susceptibilities11–14 of biomolecules. Nevertheless, the long dwell time to collect weak nonlinear signals impedes high-speed image scanning and rapid identification of pathological regions. Optical coherence tomography also shows promising results in histology,15 but imaging of subcellular features is limited due to speckle noise and spatial resolution. Quantitative phase imaging (QPI) is an alternative candidate for next-generation label-free histological methods, because it accelerates imaging speed by exploiting holographic imaging and using elastically scattering light information as an intrinsic contrast agent for biological specimens.16 Nevertheless, conventional QPI techniques provide only two-dimensional (2D) information of thin tissue samples.17,18
Optical diffraction tomography (ODT) is a three-dimensional (3D) QPI technique that achieves label-free volumetric histopathology. From transmitted-light holographic measurements at various angles, similar to x-ray computed tomography, ODT reconstructs the 3D refractive index (RI) distribution of biological cells.19,20 Because RI values depend on the number of intracellular biomolecules, including proteins and lipids, ODT allows label-free quantitative 3D morphological mapping of biological specimens and has been widely utilized to advance our understanding of the physiology of various live cells.21–25 However, several technical issues, such as a small holographic field retrieval field-of-view (FoV) and image degradation due to multiple light scattering, have hindered 3D RI-based histopathological analyses. When using this algorithm, tissue slices with thickness of up could be reconstructed with high contrast.
Here, we demonstrate multiscale label-free volumetric histopathology of thick tissue slides. We addressed the issues of limited FoV and image degradation by constructing a long-working-distance ODT optical setup and developing a robust multiscale ODT reconstruction and stitching algorithm, which consider optical aberration due to thick tissues. The experimental setup enabled mesoscopic imaging of various pathologic tissues over a millimeter-scale FoV with submicrometer resolution.
2.
Results
2.1.
Optical Setup
To image thick tissues, a custom ODT setup was built [Figs. 1(a) and 1(b)]. The system was based on a Mach–Zehnder interferometer, which was equipped with a long-working-distance objective lens for imaging thick tissues, an automated sample stage for raster-scanning, and a digital micromirror device (DMD; DLPLCR6500EVM, Texas Instrument) for illumination beam control. A blue continuous-wave laser (central , Cobolt Twist, Cobolt) was selected to avoid the H&E-staining absorption peak. A plane wave illuminated the samples with a specific illumination angle, which was systematically controlled by projecting time-multiplexed hologram patterns on the DMD.26 The intensity of the light projected on the sample by the condenser objective [LUCPLFLN40X, numerical aperture , Olympus] was of when using a camera exposure of 2 ms. The scattered field from the sample was collected by the objective lens (UPlanSAPO20X, , Olympus) and projected to the camera (LT425M-WOCG, Lumenera Inc.), where the scattered field from the sample interfered with a reference beam and generated a spatially modulated interferogram, from which both amplitude and phase images, as a function of illumination angles, were retrieved using Fourier analysis27 [Fig. 1(c)]. These multiple 2D field images were used to reconstruct a 3D RI tomogram of the sample using the Fourier diffraction theorem.28 The theoretical resolution of our imaging system, as defined by the maximum bandwidth of the optical transfer function, was 0.17 and in the lateral and axial directions, respectively.29
Fig. 1Download
Design and mechanism of a custom optical diffraction tomography apparatus. (a) Close-up view of motorized stage; (b) schematic of the optical setup. BS, beam-splitter; L, lens; M, mirror; DMD, digital micromirror device; COND, condenser lens; OBJ, objective lens. (c) Optical diffraction tomography steps: first, a hologram is retrieved by the camera; the amplitude and phase of the field transmitted through the sample are retrieved from this hologram. Finally, the RI map of the sample is obtained. (d)–(g) Stitching algorithm steps: (d) overlapping regions of adjacent tiles are retrieved; (e) phase correlation algorithm output allows retrieval of the subpixel shift between the two overlapping regions; (f) mean square error between the overlapping regions after the subpixel shift correction; (g) small FoVs are raster scanned to form a big FoV; they are then stitched together using the relative position found in (e).
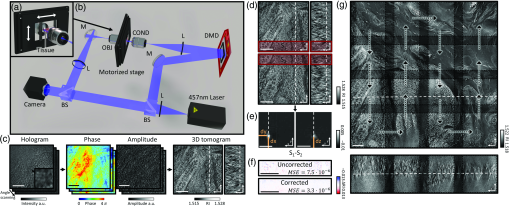
There are two main technical challenges in the reconstruction of wide and thick biological tissues: (1) alignment of multiple overlapping image tiles into a single stitched image and (2) improvement of image contrast against sample-induced aberrations. We addressed these issues computationally using correlation-based subpixel adjustments and digital field refocusing during RI reconstruction, respectively.
2.2.
Evaluation of Optical Diffraction Tomography in Thick Samples
RI reconstruction using the Fourier diffraction theorem28 is based on a weak scattering approximation and, as such, does not hold well as samples become thicker. Recently, different methods mitigating multiple scattering effects on image reconstruction have been developed.30–32 However, these are computationally expansive and are still not suitable for a wide FoV imaging. However, it has also been shown that refocusing the field at every focal plane before reconstructing the RI can increase contrast in thick samples.33,34 This method is less efficient than the previous ones, but it is computationally less expansive and has been used in our algorithm.
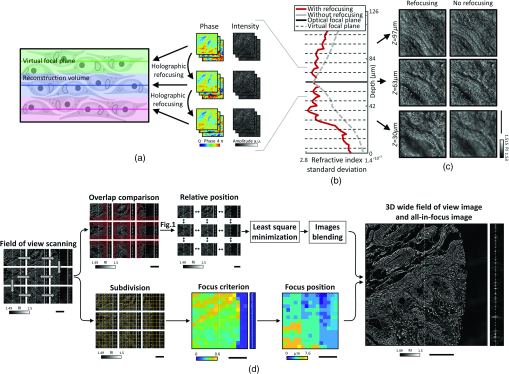
Furthermore, we only refocused the field at a few focal planes and then reconstructed the RI around those virtual focal planes. This decreases the computational cost while conserving the quality improvement from the original refocusing method. To estimate the efficiency of our algorithm, the same data were reconstructed with and without digital refocusing. Then, the imaging quality was assessed by computing the RI contrast using its standard deviation. Indeed, sample-induced aberrations cause the fields to add up destructively, reducing both contrast and resolution. From Figs. 2(b) and 2(c), one can see that when digital refocusing was not used, the contrast rapidly decreases from the optical focal plane. However, when refocusing is used, contrast again increases at every virtual focal plane. The refocusing interval is chosen as a compromise between the computation speed and contrast lost between the virtual focal planes. In this experiment, a refocusing interval of was used. Even when using digital refocusing, due to multiple light scattering, the quality of the retrieved tomograms degraded as the tissue thickness was increased. Due to this, the tissue thickness is limited to when using the current setup and sample preparation. The maximum tissue thickness might be lower for fresh tissues, but it could be increased using longer wavelength light35 or ODT techniques using spatiotemporally incoherent illumination.36 The developments of the advanced reconstruction algorithm considering multiple light scattering would also further improve the imaging thickness.37,38
Fig. 2Download
(a) Schematic of virtual focal planes and holographic refocusing; (b) RI standard deviation as a function of physical depth; (c) cross-sectional images of the reconstructed tomogram (left) with holographic refocusing and (right) without holographic refocusing. (d) Schematic of the stitching and focus finding steps. Scale bars are long.
A last limiting factor is that the illumination and detection size of single tiles is spatially limited. This limits the maximal axial FoV. Indeed, the volume that receives the detection at full numerical aperture and is illuminated by every illumination angle is limited to a conical region above and below the focal plane. Out of this region, the image will have both lower resolution and ghost images due to the circular symmetry of the discrete Fourier transform used in the reconstruction algorithm. It is important to overlap the tiles sufficiently so that these erroneous regions of the tomograms are removed when stitching. In all the experiments, an overlapping distance corresponding to 20% of the camera FoV was used.
2.3.
Sample Preparation
It is crucial when imaging thick samples to use RI matching to limit multiple light scattering. Formalin-fixed paraffin-embedded tissue blocks from the normal small intestine, colon, and pancreas, and from the pancreatic neuroendocrine tumor and intraductal papillary neoplasm of the bile duct were selected. Tissue blocks were sliced with thickness, deparaffinized using three consecutive 10 min xylene bath, and finally mounted between two number zero coverslips using Permount mounting medium (Permount, , Fisher Chemical). Thin -thick sections were mounted on 1-mm-thick slide glass with Acrymount mounting medium.
2.4.
Stitching Segmented Tomograms
Accurate image alignment between overlapping image tiles was achieved by correlation-based subpixel adjustment [Figs. 1(d)–1(g)]. During data acquisition, overlapping regions between adjacent 3D tiles were set to 20%, which guaranteed border artifact suppression during RI reconstruction [Fig. 1(d)]. The precise relative 3D position between overlapping regions was then determined with subpixel accuracy using a phase-correlation algorithm39 [Fig. 1(e)]. This position-correcting process enabled artifact reduction due to image misalignment, as evidenced by a mean squared errors analysis [Fig. 1(f)]. Next, the global positions of multiple image tiles were further adjusted using least square minimization.40 Minimization was weighted using the Pearson correlation coefficient of overlapping sections. This allowed quantifying similarity between overlapping regions and thus gave less importance to regions without tissue, where finding the relative position was more difficult. Weighting and the use of robust least square minimization avoided error propagation. Finally, images were placed at the obtained position and seamlessly blended together [Fig. 1(g)].
An important consideration when using stitching with ODT is that the illumination and detection size of single tiles is spatially limited. This limits the maximal axial FoV. Indeed, the volume that receives the detection at full numerical aperture and is illuminated by every illumination angle is limited to a conical region above and below the focal plane. Out of this region, the image will have both lower resolution and ghost images due to the circular symmetry of the discrete Fourier transform used in the reconstruction algorithm. It is, as such, important to overlap the tiles sufficiently so that these erroneous regions of the tomograms are removed when stitching. In all the experiments, an overlapping distance corresponding to 20% of the camera FoV was used.
2.5.
Focus Finding in Tissues
The use of coherent light in ODT allows the focal plane to be adjusted numerically, avoiding blurring artifacts due to focus mismatching,41 which occurs in bright-field microscopy and other incoherent imaging methods. In our reconstruction algorithm, when imaging thin samples, the sample position is first automatically detected, and then an image containing only the most in-focus part of the tissue is generated. The optimal focus plane was found using the Tamura of the gradient focus criterion42 on the tomogram, which is a function that reaches its maximum when an image is well focused. The focal position was researched in this way every and interpolated in regions without samples. This method was also used in thick tissue to quickly find high contrast well-focused lateral cross-sections. Alternatively, the lateral shift between the fields taken from different illumination angles could also be used to find the focus position in a thin sample.43
2.6.
Reconstruction of Refractive Index Distributions
Initially, reconstructed tomograms of thick tissues suffered from weak image contrast and distortion due to sample-induced aberrations. Considering that samples nearest the optical focal plane display sharper image contrast when reconstructed with the Rytov approximation, we exploited holographic refocusing to reconstruct 3D RI maps with higher image contrast33,34 [Figs. 2(a)–2(c)]. We digitally refocused the obtained light field images to virtual focal planes using a diffraction kernel based on Green’s function [Fig. 2(a)]. The refocusing interval is chosen as a compromise between the computation speed and contrast lost between the virtual focal planes. Here, we set the refocusing interval to , reconstructed volumetric RI tomograms thick with a voxel size of around each virtual focal plane, and combined the tomogram stack into a single tomogram. Qualitative comparison validated that the RI tomograms out of a focal plane could recover image contrast using refocusing-based RI reconstruction [Fig. 2(b)]. The RI distribution root-mean-squares also increased at the out-of-focus planes, quantitatively confirming that digital refocusing improved RI contrast of reconstructed thick tissue tomograms [Fig. 2(c)].
These algorithms were implemented on a graphical processing unit (GPU) to facilitate reconstruction speed. In particular, since phase unwrapping has to be performed at every refocusing step, phase unwrapping is a particularly computationally intensive part of the process. To improve performance, we implemented a custom version of Goldstein’s phase unwrapping algorithm,44 where the residue pairing was realized on the CPU, while residue detection, residue linking, rasterization, and phase unwrapping were performed on the GPU.
2.7.
Demonstration in Thick and Thin Tissues
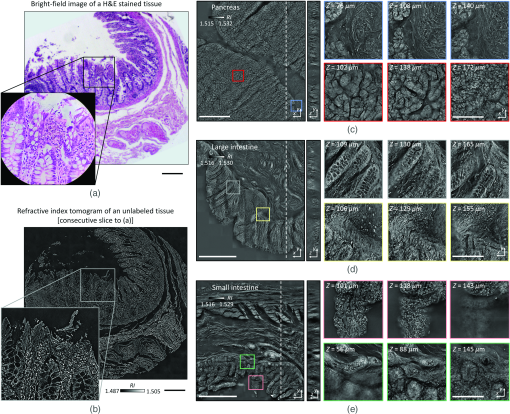
To validate the capacity of the present method for tissue slides volumetric histopathology, we first measured human small intestine tissue samples. For comparison purposes, we prepared two consecutive tissue slides, one using conventional H&E staining and the other unlabeled. The XY cross-sectional images of the unlabeled slide in the optical focal plane were consistent with the conventional in-focus bright-field images of the H&E-stained slide, demonstrating the high accuracy of this method [Figs. 3(a) and 3(b)]. Overall tissue anatomy and subcellular features were clearly seen in both the conventional H&E image and RI tomogram. To demonstrate applicability, various histopathology tissue slides were imaged [Figs. 3(c)–3(e)]. Unlabeled tissue samples from human organs (pancreas, small intestines, and large intestines) were cut at a thickness of and analyzed using the present method. The resulting FoVs were . The capability of volumetric histopathology can be seen in the high-resolution images of subparts at various axial foci [insets, Figs. 3(c)–3(e)]. Not only can subcellular features be accessed without labeling, but the 3D architecture of tissue structures can also be investigated.
Fig. 3Download
(a) Comparison of a normal colon tissue slice imaged with bright field and stained with H&E and (b) an unstained neighbor tissue slice imaged with ODT. In (a), the zoomed in image was taken with a 60× objective lens, while, in (b), the zoomed in image is a cropped version of the stitched image. (c)–(e) 3D wide field images of -thick tissue slices of (c) pancreas, (d) colon, and (e) small intestine. Zoomed in regions of interest are shown at different depths. Scale bars are long in (a), (b) and zoom in from (c)–(e). Scale bars are long in wide FoV images of (c)–(e).
2.8.
Imaging Pathologic Tissue Slides
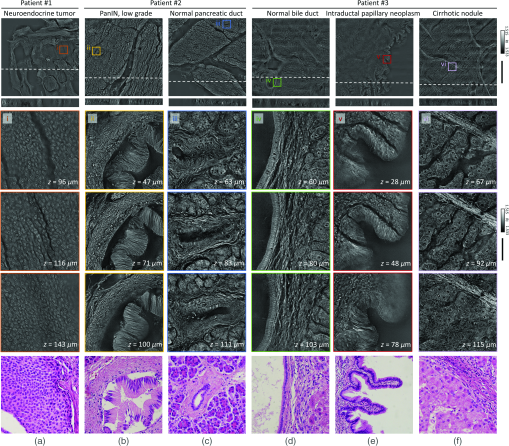
To validate further the present method for clinical applications, volumetric images of unlabeled thick pancreas tissues samples obtained from patients with pancreas neoplasms are shown in Fig. 4. The RI tomograms of tissues from patient #1 [Fig. 4(a)] show neoplastic epithelial cells with phenotypic neuroendocrine differentiation, characteristics of a pancreatic neuroendocrine tumor (PanNET). The back-to-back neoplastic cells with minimal stroma are easily appreciated, as is the uniformity in the shape of the round nuclei. All of these allow for the recognition of the diagnosis. For validation purposes, adjacent tissues were prepared and imaged using the conventional H&E staining method, which exhibit good agreement with the present method. The RI tomograms of the tissues from patient #2 show low-grade pancreatic intraepithelial neoplasia (PanIN) as well as normal pancreatic ducts, which show different cytoplasmic features between normal pancreatic ducts and low grade PanIN [Figs. 4(b) and 4(c)]. In the liver tissues from patient #3, the normal bile duct, intraductal papillary neoplasm of bile duct (IPNB), and cirrhotic nodule are imaged with the present method [Figs. 4(d)–4(f)]. Thus, different tumor types and a variety of precursor lesions and pathologies can be visualized.
Fig. 4Download
Volumetric histopathology of unlabeled -thick pancreas tissue samples from three individuals: (a) patient with a pancreatic neuroendocrine tumor; (b), (c) patient with pancreatic intraepithelial neoplasia (PanIN); and (d)–(f) patient with IPNB in the liver. The areas indicated with the boxes (i)–(vi) are shown at three different axial positions with magnification (from the second to the fourth rows). For comparison purposes, adjacent tissues were prepared in thin tissue slides with the conventional H&E staining method. (The fifth row, magnification.) Scale bars are long in wide FoV images and long in zoomed regions of interest.
3.
Discussion and Conclusion
We present multiscale volumetric imaging of unlabeled tissue samples. We imaged millimeter-scale, unstained, -thick tissues at a subcellular 3D resolution, which enabled the visualization of individual cells and multicellular tissue architectures in a variety of tissues. By systematically stitching 3D RI tile data obtained with a long-working-distance ODT setup, we demonstrated an FoV of with a spatial resolution of , and, throughout this extended imaging volume, image degradation due to sample-induced aberration was significantly reduced using the holographic refocusing strategy. The present method can be understood as extremely high content imaging. The number of optical modes, calculated as the reconstructed volume divided by the size of the point spread function, was .
Considering the label-free volumetric imaging capability exhibited across a variety of tissue samples, this method could potentially be used for rapid cancer diagnosis during intraoperative pathology consultations or small biopsy samples. In addition, the present digital pathology approach has considerable advantages over conventional imaging methods, particularly in terms of measuring seamless multiscale volumetric images; conventional methods only generate one or a few focused plane images. In the current system, the time needed to measure sections () and produce volumetric reconstructions is 40 and 135 min, respectively. However, this can be further expedited by implementing a high-speed translational stage, a fast image sensor, and more powerful computing power.
To make the method more applicable, more research is needed on the imaging of fresh tissues and the histological interpretation of RI information. Because RI tomograms do not generate the same data as H&E staining, they would be utilized as complementary information. We envision that this generic approach could have far-reaching applications in histopathology and cytometry, possibly in conjunction with newly emerging machine learning methods for segmentation and cell-type classification.
Acknowledgments
H.H., R.H.H., S.-M.H., and Y.P. conceived the initial idea. H.H. developed the optical system and analysis methods. H.H. and Y.W.K. performed the experiments and analyzed the data. M.L. and S.S. provided the analysis methods and analyzed the data. All authors wrote and revised the manuscript. This work was supported by KAIST, Up Program, BK21+ program, Tomocube, and National Research Foundation of Korea (2017M3C1A3013923, 2015R1A3A2066550, and 2018K000396). Professor Park and Mr. Moosung Lee have financial interests in Tomocube Inc., a company that commercializes optical diffraction tomography and quantitative phase imaging instruments and is one of the sponsors of the work.
Code, Data, and Materials Availability
Higher resolution images of the central cross sections of the tissues are available in the Supplementary Material. Full resolution 3D images are available on request. Correspondence and requests for materials should be addressed to Y.P.
References
H. Suchannek, “Beiträge zur feinern normalen Anatomie des menschlichen Geruchsorganes,” Arch. mikroskopische Anat., 36 (1), 375 –403 (1890). https://doi.org/10.1007/BF02956002 Google Scholar
A. H. Coons, H. J. Creech and R. N. Jones, “Immunological properties of an antibody containing a fluorescent group,” Proc. Soc. Exp. Biol. Med., 47 (2), 200 –202 (1941). https://doi.org/10.3181/00379727-47-13084P PSEBAA 0037-9727 Google Scholar
M. Titford, “The long history of hematoxylin,” Biotech. Histochem., 80 (2), 73 –78 (2005). https://doi.org/10.1080/10520290500138372 BIHIEU 1052-0295 Google Scholar
J. I. Hamburger et al., “Increasing the accuracy of fine-needle biopsy for thyroid nodules,” Arch. Pathol. Lab. Med., 113 (9), 1035 –1041 (1989). APLMAS 0003-9985 Google Scholar
R. J. Buesa, “Histology: a unique area of the medical laboratory,” Ann. Diagn. Pathol., 11 (2), 137 –141 (2007). https://doi.org/10.1016/j.anndiagpath.2007.01.002 Google Scholar
M. Wang et al., “Gigapixel surface imaging of radical prostatectomy specimens for comprehensive detection of cancer-positive surgical margins using structured illumination microscopy,” Sci. Rep., 6 (1), 27419 (2016). https://doi.org/10.1038/srep27419 SRCEC3 2045-2322 Google Scholar
A. K. Glaser et al., “Light-sheet microscopy for slide-free non-destructive pathology of large clinical specimens,” Nat. Biomed. Eng., 1 (7), 0084 (2017). https://doi.org/10.1038/s41551-017-0084 Google Scholar
H. Tu et al., “Stain-free histopathology by programmable supercontinuum pulses,” Nat. Photonics, 10 (8), 534 –540 (2016). https://doi.org/10.1038/nphoton.2016.94 NPAHBY 1749-4885 Google Scholar
C. W. Freudiger et al., “Label-free biomedical imaging with high sensitivity by stimulated Raman scattering microscopy,” Science, 322 (5909), 1857 –1861 (2008). https://doi.org/10.1126/science.1165758 SCIEAS 0036-8075 Google Scholar
A. Zumbusch, G. R. Holtom and X. S. Xie, “Three-dimensional vibrational imaging by coherent anti-Stokes Raman scattering,” Phys. Rev. Lett., 82 (20), 4142 –4145 (1999). https://doi.org/10.1103/PhysRevLett.82.4142 PRLTAO 0031-9007 Google Scholar
D. Débarre et al., “Imaging lipid bodies in cells and tissues using third-harmonic generation microscopy,” Nat. Methods, 3 (1), 47 –53 (2006). https://doi.org/10.1038/nmeth813 1548-7091 Google Scholar
J. A. Squier et al., “Third harmonic generation microscopy,” Opt. Express, 3 (9), 315 –324 (1998). https://doi.org/10.1364/OE.3.000315 OPEXFF 1094-4087 Google Scholar
D. Yelin and Y. Silberberg, “Laser scanning third-harmonic-generation microscopy in biology,” Opt. Express, 5 (8), 169 –175 (1999). https://doi.org/10.1364/OE.5.000169 OPEXFF 1094-4087 Google Scholar
W. R. Zipfel et al., “Live tissue intrinsic emission microscopy using multiphoton-excited native fluorescence and second harmonic generation,” Proc. Natl. Acad. Sci. U. S. A., 100 (12), 7075 –7080 (2003). https://doi.org/10.1073/pnas.0832308100 PNASA6 0027-8424 Google Scholar
O. Assayag et al., “Large field, high resolution full-field optical coherence tomography: a pre-clinical study of human breast tissue and cancer assessment,” Technol. Cancer Res. Treat., 13 (5), 455 –468 (2014). https://doi.org/10.7785/tcrtexpress.2013.600254 Google Scholar
Y. Park, C. Depeursinge and G. Popescu, “Quantitative phase imaging in biomedicine,” Nat. Photonics, 12 (10), 578 –589 (2018). https://doi.org/10.1038/s41566-018-0253-x NPAHBY 1749-4885 Google Scholar
Z. Wang et al., “Tissue refractive index as marker of disease,” J. Biomed. Opt., 16 116017 (2011). https://doi.org/10.1117/1.3656732 JBOPFO 1083-3668 Google Scholar
M. Lee et al., “Label-free optical quantification of structural alterations in Alzheimer’s disease,” Sci. Rep., 6 (1), 31034 (2016). https://doi.org/10.1038/srep31034 SRCEC3 2045-2322 Google Scholar
E. Wolf, “Three-dimensional structure determination of semi-transparent objects from holographic data,” Opt. Commun., 1 (4), 153 –156 (1969). https://doi.org/10.1016/0030-4018(69)90052-2 OPCOB8 0030-4018 Google Scholar
K. Kim et al., “Optical diffraction tomography techniques for the study of cell pathophysiology,” J. Biomed. Photonics Eng., 2 (2), 020201 (2016). https://doi.org/10.18287/JBPE16.02.020201 Google Scholar
Y. Kim et al., “Profiling individual human red blood cells using common-path diffraction optical tomography,” Sci. Rep., 4 (1), 6659 (2014). https://doi.org/10.1038/srep06659 SRCEC3 2045-2322 Google Scholar
Y. Park et al., “Refractive index maps and membrane dynamics of human red blood cells parasitized by Plasmodium falciparum,” Proc. Natl. Acad. Sci. U.S.A., 105 (37), 13730 –13735 (2008). https://doi.org/10.1073/pnas.0806100105 PNASA6 0027-8424 Google Scholar
S.-A. Yang et al., “Measurements of morphological and biophysical alterations in individual neuron cells associated with early neurotoxic effects in Parkinson’s disease,” Cytom. Part A, 91 (5), 510 –518 (2017). https://doi.org/10.1002/cyto.a.23110 1552-4922 Google Scholar
G. Dardikman-Yoffe et al., “High-resolution 4-D acquisition of freely swimming human sperm cells without staining,” Sci. Adv., 6 (15), eaay7619 (2020). https://doi.org/10.1126/sciadv.aay7619 STAMCV 1468-6996 Google Scholar
F. Merola et al., “Tomographic flow cytometry by digital holography,” Light Sci. Appl., 6 (4), e16241 (2017). https://doi.org/10.1038/lsa.2016.241 Google Scholar
K. Lee et al., “Time-multiplexed structured illumination using a DMD for optical diffraction tomography,” Opt. Lett., 42 (5), 999 –1002 (2017). https://doi.org/10.1364/OL.42.000999 OPLEDP 0146-9592 Google Scholar
M. Takeda, H. Ina and S. Kobayashi, “Fourier-transform method of fringe-pattern analysis for computer-based topography and interferometry,” J. Opt. Soc. Am., 72 (1), 156 –160 (1982). https://doi.org/10.1364/JOSA.72.000156 JOSAAH 0030-3941 Google Scholar
“Scattering from inhomogeneous media,” Principles of Optics: Electromagnetic Theory of Propagation, Interference and Diffraction of Light, 695 –734 Cambridge University Press, Cambridge (1999). Google Scholar
C. Park, S. Shin and Y. Park, “Generalized quantification of three-dimensional resolution in optical diffraction tomography using the projection of maximal spatial bandwidths,” J. Opt. Soc. Am. A, 35 (11), 1891 –1898 (2018). https://doi.org/10.1364/JOSAA.35.001891 JOAOD6 0740-3232 Google Scholar
J. Lim et al., “High-fidelity optical diffraction tomography of multiple scattering samples,” Light Sci. Appl., 8 (1), 82 (2019). https://doi.org/10.1038/s41377-019-0195-1 Google Scholar
U. S. Kamilov et al., “Learning approach to optical tomography,” Optica, 2 (6), 517 –522 (2015). https://doi.org/10.1364/OPTICA.2.000517 Google Scholar
S. Fan et al., “Optical fiber refractive index profiling by iterative optical diffraction tomography,” J. Lightwave Technol., 36 (24), 5754 –5763 (2018). https://doi.org/10.1109/JLT.2018.2876070 JLTEDG 0733-8724 Google Scholar
A. Goy et al., “Imaging thick samples with optical tomography,” (2017). Google Scholar
J. Kostencka et al., “Holographic tomography with scanning of illumination: space-domain reconstruction for spatially invariant accuracy,” Biomed. Opt. Express, 7 (10), 4086 –4101 (2016). https://doi.org/10.1364/BOE.7.004086 BOEICL 2156-7085 Google Scholar
S. L. Jacques, “Optical properties of biological tissues: a review,” Phys. Med. Biol., 58 (11), R37 –R61 (2013). https://doi.org/10.1088/0031-9155/58/11/R37 PHMBA7 0031-9155 Google Scholar
T. H. Nguyen et al., “Gradient light interference microscopy for 3D imaging of unlabeled specimens,” Nat. Commun., 8 (1), 210 (2017). https://doi.org/10.1038/s41467-017-00190-7 NCAOBW 2041-1723 Google Scholar
J. Lim et al., “Beyond Born––Rytov limit for super-resolution optical diffraction tomography,” Opt. Express, 25 (24), 30445 –30458 (2017). https://doi.org/10.1364/OE.25.030445 OPEXFF 1094-4087 Google Scholar
D. Ryu et al., “DeepRegularizer: rapid resolution enhancement of tomographic imaging using deep learning,” (2020). Google Scholar
H. Foroosh, J. B. Zerubia and M. Berthod, “Extension of phase correlation to subpixel registration,” IEEE Trans. Image Process., 11 (3), 188 –200 (2002). https://doi.org/10.1109/83.988953 IIPRE4 1057-7149 Google Scholar
S. Preibisch, S. Saalfeld and P. Tomancak, “Globally optimal stitching of tiled 3D microscopic image acquisitions,” Bioinformatics, 25 (11), 1463 –1465 (2009). https://doi.org/10.1093/bioinformatics/btp184 BOINFP 1367-4803 Google Scholar
P. Ferraro et al., “Extended focused image in microscopy by digital holography,” Opt. Express, 13 (18), 6738 –6749 (2005). https://doi.org/10.1364/OPEX.13.006738 OPEXFF 1094-4087 Google Scholar
Y. Zhang et al., “Edge sparsity criterion for robust holographic autofocusing,” Opt. Lett., 42 (19), 3824 –3827 (2017). https://doi.org/10.1364/OL.42.003824 OPLEDP 0146-9592 Google Scholar
L. Che et al., “Exploiting a holographic polarization microscope for rapid autofocusing and 3D tracking,” Biomed. Opt. Express, 11 (12), 7150 –7164 (2020). https://doi.org/10.1364/BOE.405585 BOEICL 2156-7085 Google Scholar
D. C. Ghiglia and M. D. Pritt, Two-Dimensional Phase Unwrapping: Theory, Algorithms, and Software, Wiley, New York (1998). Google Scholar
Biography
Herve Hugonnet is a graduate student at the Korea Advanced Institute of Science and Technology. He obtained his bachelor in physics at the Swiss Federal Institute of Technology Lausanne in 2017. His main research interest is non-linear reconstruction in optical diffraction tomography.
Moosung Lee received his BS degree in physics from KAIST, Daejeon, South Korea, in 2016. He is working toward the PhD with the Department of Physics, KAIST, Daejeon, South Korea. He is currently affiliated with Prof. Y. Park’s research group, where he has studied three-dimensional live cell imaging. His research interests include biomedical applications of microscopy techniques.
Seung-Mo Hong graduated from Kyung Hee University College of Medicine, Seoul and received his PhD from University of Ulsan College of Medicine, Seoul, Korea. He is a pathologist and specialty of pancreatobiliary tract and gastrointestinal tract. Currently, he is professor of the Department of Pathology, Asan Medical Center, University of Ulsan College of Medicine. His research fields are early detection, biomarker discovery, and 3 dimensional pathologic imaging of pancreatobiliary and gastrointestinal tracts cancers.
I have realized some new points from your internet site about personal computers. Another thing I have always presumed is that laptop computers have become a specific thing that each family must have for a lot of reasons. They provide convenient ways to organize homes, pay bills, search for information, study, focus on music and even watch tv shows. An innovative way to complete most of these tasks is by using a notebook. These computer systems are mobile, small, robust and easily transportable.
The very next time I read a blog, Hopefully it does not fail me just as much as this particular one. I mean, I know it was my choice to read, nonetheless I actually thought you’d have something useful to say. All I hear is a bunch of moaning about something that you can fix if you weren’t too busy seeking attention.
242498 688665Respect to internet site author , some amazing entropy. 6012
Undeniably believe that which you said. Your favorite justification seemed to be on the
net the simplest thing to be aware of. I say to you, I certainly get annoyed while people
think about worries that they just do not know about.
You managed to hit the nail upon the top and defined out the
whole thing without having side effect , people can take a signal.
Will probably be back to get more. Thanks
I appreciate the post with your Okay I can share this info with my network?
I used to be able to find good information from your articles.